Creating resilience
If 2020 taught us anything, it was that we underestimate the pivotal role of the supply chains in our lives and how fragile these global networks are. There is a pressing need to build robust, scalable, and less vulnerable supply chains.
Our challenging circumstances are set to continue for the foreseeable future. While we’re likely to see a roll-back from over-reliance on single-sourced goods, modern capitalism depends upon global markets.
The issue is the more complex a supply chain, the more vulnerable it is. As supply chain technology experts Transparency-One point out: “Supply chains that incorporate multiple tiers, are heavily globalized and/or involve a number of components or stages of transformation, are inherently more complicated and at greater risk of being severely affected by a crisis like Covid-19.”
Transparency in the supply chain becomes more vital and more complex so that brands can prepare and manage challenging events like a pandemic. CIOs need a highly scalable way to manage the vast volumes of serial numbers, supplier and facility details, certifications, documents, and detailed questionnaires they need to get on top of the crisis and re-start their businesses once the pandemic eases.
As a result, manufacturers, distributors, and logistics companies need a more agile way of dealing with the vast amount of intertwined data and regulations involved with delivering items globally. At the same time, brands need to win back consumer and customer confidence—and in some cases, trust. And all this needs to occur while ensuring products meet international standards and regulations and maintain sustainability and social responsibility standards.
Big data issues
To address immediate issues and restore operations while also positioning ourselves for long-term success, brands need a better understanding of the data flowing in and out of their supply chains. With that insight, they can gain real-time insight to support smart, data-driven decision-making.
Companies that have 360-degree visibility of their supply chains and supplier ecosystem understand how this will impact production. They know they need to look for alternative sources if there is a shortage of components, for example, or if ports are locked down. Operators underprepared for this, or indeed the next significant disruption, will find it almost impossible to mitigate supply shock and manage demand volatility.
Many enterprises still have their data stored in silos, meaning they only have a partial view of what is going on in their supply chains. According to Forrester Analyst Alla Valente, the supply chain risk management tech stack often consists of Excel and SharePoint, which don’t have the ability to handle the data volumes or the sophisticated analysis required. Even if the data is stored in a single business database, she warns, understanding the connections between products on a production line or in pallets waiting to be shipped is next to impossible. Making traditional databases perform multidimensional tasks in real-time is also not a viable option, with performance degradation as the total dataset size grows.
Built expressly for connected data
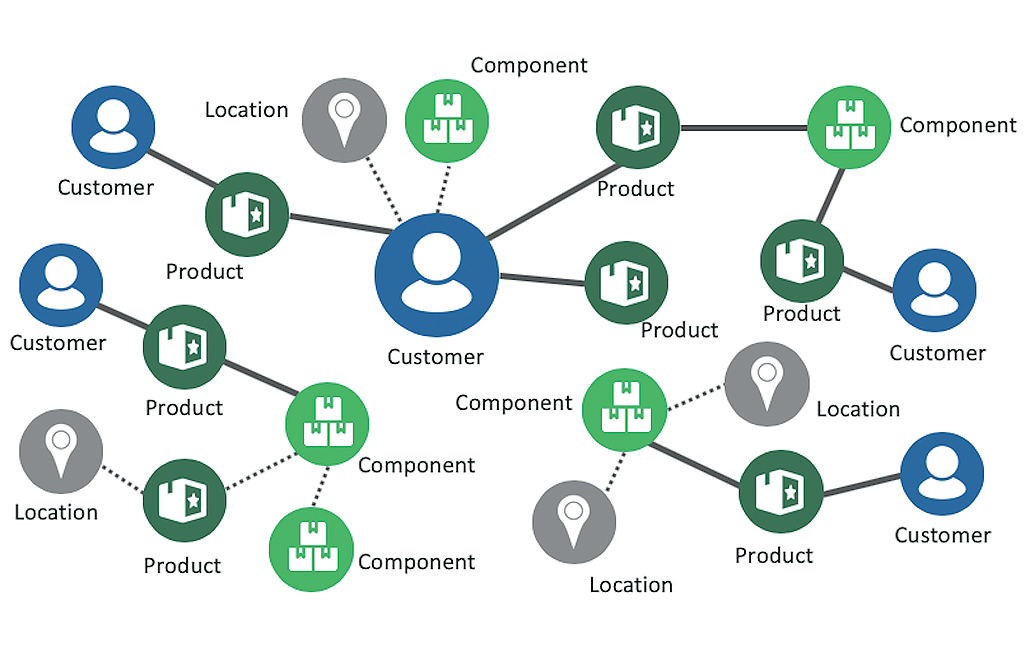
There is an answer in the shape of graph technology, an approach in data management that records and ‘connects the dots’ between complex data interdependencies. When you track a product or component, you create a hierarchy of data and store how it’s all connected. An example of the power graph databases offer in uncovering relationships in big data was highlighted by the Panama and Paradise Papers exposes. The group behind the investigation, the International Consortium of Investigative Journalists, used graph technology to map incredibly complex financial connections and spot irregularities in history’s largest data leaks.
As graph-based tools are built expressly for connected data, performance is maintained across vast quantities of data. This is a useful capability as the number of unique serial codes alone can run into the billions. Suppose you record the code on a particular pallet, then a graph database can automatically recall all of its contents. This includes the operational context, such as which ports it shipped through, where it was manufactured, and the relationships between manufacturers.
Using a graph database, firms can typically demonstrate 100 times faster query response speeds than from traditional relational database software. This elevated response time is critical during the current crisis and will be crucial going forward in a highly digitized and increasingly competitive world.
Be ready for the next wave of disruption
Without a doubt, Covid-19 was a particularly dramatic upset to global supply chains. Still, disruptive events are not new: tsunamis in Japan, flooding in Thailand, major storms and hurricanes, even previous waves of illness (SARS, Ebola) have all had a significant impact on supply chains. It remains to be seen if Brexit-related supply chain chaos will persist.
Company leaders need to make sourcing appropriate tools and technology to provide visibility and insight into the complex, interconnected supply chains they work with a priority.
If they view their supply chain as the networks they truly represent, they can maximize opportunities as the world resets and buffer themselves against the likely fact of recurrent, future business risk.
Amy Hodler is Director, Analytics and AI Program at Neo4j, the world’s leading graph database company. Amy is also co-author of Graph Algorithms: Practical Examples in Apache Spark & Neo4j, published by O’Reilly Media.
Neo4j is the leader in graph database technology. As the world’s most widely deployed graph database, it helps global brands – including Comcast, NASA, UBS and Volvo – to reveal and predict how people, processes, and systems are interrelated. Using this relationships-first approach, applications built with Neo4j tackle connected data challenges such as analytics and artificial intelligence, fraud detection, real-time recommendations, and knowledge graphs.
www.neo4j.com