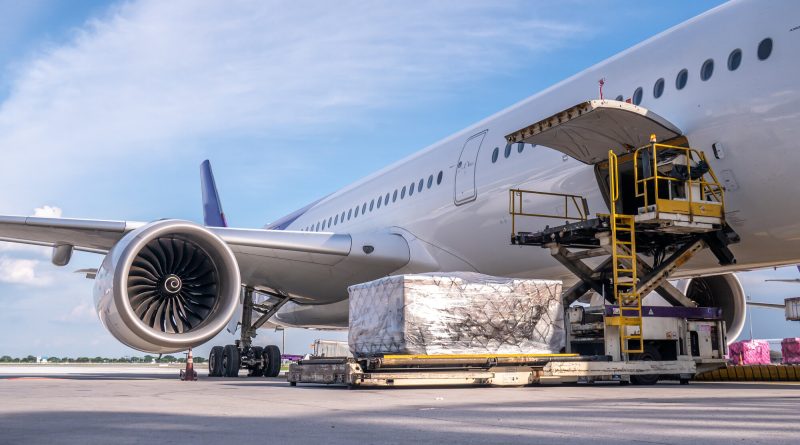
AI shipments push air cargo demand up 7.7% as fuel costs bite
Subscribe to our free newsletter today to keep up to date with the latest supply chain news.
Global air cargo demand rose 7.7% year on year in September, according to data released by the International Air Transport Association (IATA) on Oct. 29. Capacity grew by just 2.7% over the same period, lifting the industry’s cargo load factor by 2.2 percentage points to 47.9%.
Every region recorded growth. North American carriers led with an 11.8% rise in demand, while the Asia to North America trade lane grew 17.0%, its eighth consecutive month of expansion.
IATA linked part of that transpacific strength to the artificial intelligence boom. Marie Owens Thomsen, IATA’s senior vice president sustainability and chief economist, said AI-related shipments helped push transpacific growth into double digits for another month.
The cost side of the picture is less comfortable. Jet fuel prices rose 17.5% from August to September and were 103.4% higher than a year earlier. Owens Thomsen said yields, the revenue airlines earn for carrying cargo, have not kept pace.
“There is no shortage of goods to ship,” she said. The harder part, she added, is moving those goods profitably while fuel prices stay high.
The AI build-out is filling transpacific cargo holds
Asia to North America is the largest lane in IATA’s trade data, accounting for 23.5% of industry traffic based on full-year 2025 figures. A 17.0% gain on a lane of that size does much of the work behind the global headline number.
IATA does not say how much of the growth comes from AI hardware. Its attribution still makes a useful point for supply chain planners. The AI build-out is a physical supply chain story, not only a software one. Servers, chips, and networking equipment are high-value goods that buyers want quickly, which makes them natural air freight.
The regional figures need one caveat. IATA reports regional performance by where carriers are based, not where cargo is going. North America’s 11.8% growth, set against capacity growth of only 0.8%, describes North American airlines, whose load factor rose 4.3 points to 43.9%. The trade lane data gives the clearer view of the flows themselves.
Other major lanes grew too. Traffic within Asia rose 10.2%, its 35th consecutive month of growth, while Europe to North America increased 9.3% and Europe to Asia gained 6.0%.
The wider economy offered support. IATA said global trade rose 3.6% year on year in August, extending its run of monthly expansions to 42 months. Global manufacturing output and new export orders indices both reached their highest levels in 5 years that month.
Fuel costs could turn strong air cargo demand into higher rates
Demand growing nearly 3 times faster than capacity would normally hand carriers pricing power. This time, fuel is absorbing much of it.
For shippers, that raises an awkward question. If yields keep trailing fuel costs, carriers have 2 obvious responses: pass more of the cost on through surcharges and contract rates, or pull capacity from routes that no longer pay. Either would fall on the businesses that depend on air freight for urgent or high-value goods.
The AI hardware trade is a good example. Buyers racing to install data center equipment have little appetite for slower ocean transit, which leaves them exposed if air rates rise. The same applies to pharmaceuticals, electronics, and spare parts shipped to keep production lines running.
IATA’s figures do not show how much of the fuel increase has already reached shipper invoices. That will depend on how airlines structure surcharges and how much spare capacity remains on each lane. With global capacity growing at 2.7%, there is not much slack to compete away.
Middle East corridors are shrinking while the Pacific accelerates
Not every lane shared in the growth. Europe to Middle East traffic fell 18.0% and Middle East to Asia dropped 10.2%, both in their seventh straight month of contraction. Middle Eastern carriers posted the weakest regional demand growth, at 3.8%, while adding 7.0% more capacity, so their load factor fell 1.4 points to 44.0%.
IATA’s release does not explain the decline. Gulf hubs are major transfer points for cargo moving between Asia and Europe, so 7 months of contraction on both sides of that bridge suggests a change in how some of that freight is routed.
For shippers, it is a reminder that lane-level data can diverge sharply from the global average. A 7.7% headline masks a market where some corridors are tightening fast and others are losing volume.
The open questions are whether AI-related demand holds into the new year, whether carriers can pass fuel costs on without denting volumes, and whether Middle East traffic recovers or settles into new routes. IATA’s next monthly release will offer the first sign.
Source:
IATA press release